MedSeaRise helps coastal cities understand and prepare for the impacts of sea level rise.
It is often stated that coastal cities should develop adaptation strategies to address the impacts of climate change. However, despite the emphasis on this issue, stakeholders frequently find themselves lacking ready-to-use information on future impacts. This information is essential for designing effective strategies.
The MedSeaRise Approach
This is precisely the challenge that the MedSeaRise aims to address: the development of a methodology that provides stakeholders with impact indicators based on global warming scenarios, through the effective use of existing data.
One of the goals of the MedSeaRise project is to generate case studies that support the proposed methodology through practical applications. In this project period, the set of case studies is in progress, and some of them have already been completed. It is the case of the A-03_PP2 case study, which is focused on the floodable areas of the Grado town.
About Grado
Specifically, Grado is a picturesque town located on a lagoon island in the Friuli Venezia Giulia region of northeastern Italy. The city features sandy beaches, a charming historic center, and thermal spas. Once a Roman port and later an important medieval town, Grado retains traces of its rich past in many sites scattered around the city.
The city also offers a mild atmosphere, making it a popular destination for relaxation, nature, and cultural tourism, besides to being a well-known and frequented spa town. Due to its location, Grado has already experienced many flooding events caused by extremely high tides. These events are expected to increase in frequency with sea level rise. That is why Grado was chosen to become a case study.
Methodology and Data Collection
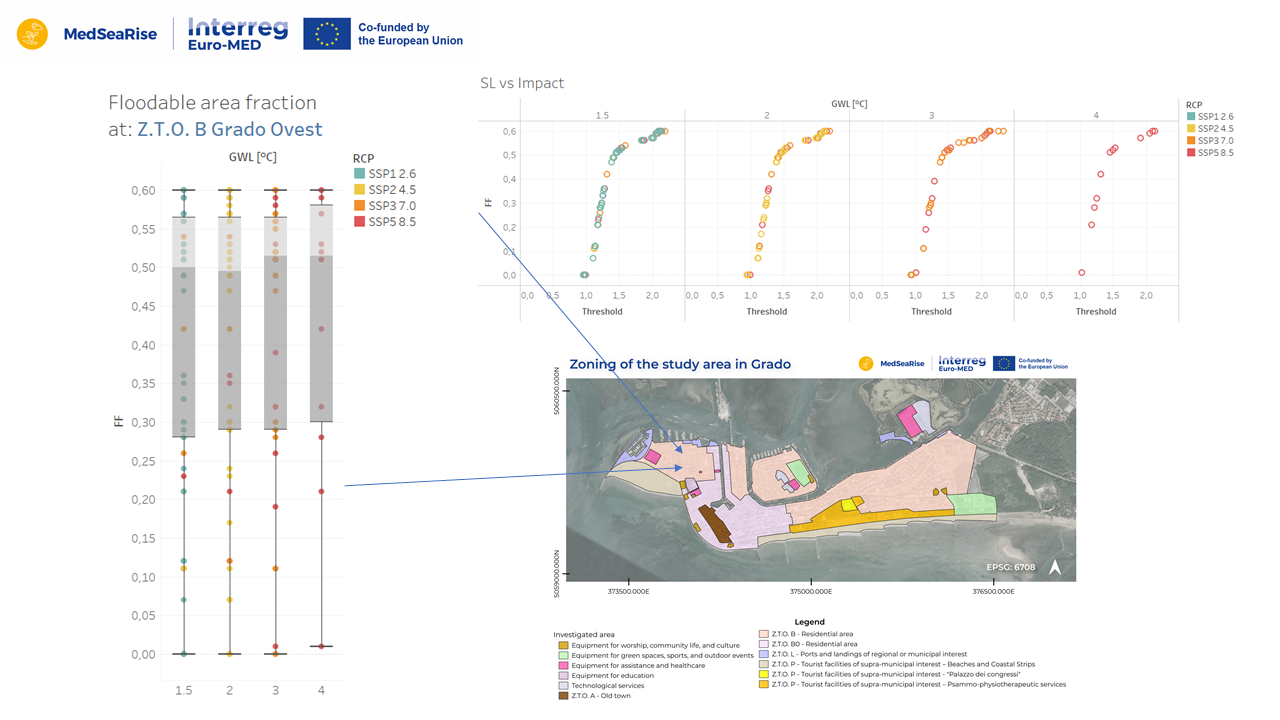
The research team divided the investigated area into subzones based on the zoning that the Municipality of Grado’s territorial management plan establishes. We then collected essential data for the case study. These included: a) the sea level rise projections, corresponding to different global warming level (GWL) scenarios b) the local tide gauge station measured the historical series of tide records, and c) the Autonomous Region Friuli Venezia Giulia (RAFVG) provided the digital elevation model (DEM).
Using GIS software, the team analyzed the DEM to compute the floodable fraction of each subzone under every combination of tidal event and sea level rise scenario. They conducted a total of 195 simulations. We then used the output of this process to generate a risk curve. This curve relates the probability of occurrence and the severity of flooding to the projected Global Warming Level (GWL) scenario.
Next Steps
Meanwhile, the team is currently discussing and interpreting these results. In the coming months, the team will present the results to the stakeholders involved in the project.


